1. Help Center
  2. Clients
  3. Clients Using LLS Buzz

Buzz Client Administrator Resource

This article highlights the monitoring capabilities of the Client Administrator role in Buzz for clients who are using their own teachers.

BUZZ CLIENT ADMINISTRATOR ROLE DESCRIPTION

This role provides users read-only access to be able to proxy as users, run teacher activity reports, and view Lincoln Learning course sections that are utilized by client teachers.

IMPORTANT: This role is only available to clients who use their own teachers.

ARTICLE QUICK LINKS 

This article includes the following primary sections.  Use these links to navigate directly to that section.

SWITCHING ROLES

Within Buzz, you begin as a teacher. You may or may not have courses.

To switch roles at any time, click on the grid icon located to the left of your avatar in the upper-right corner.

From the drop-down menu, select Admin App or Teacher App.

Click here to return to the list of Article Quick Links.

ADJUSTING THE DOMAIN

Subdomains

First, make sure you are in the Home page for the Admin App. Next, look for the tab called SUBDOMAINS.

Within the SUBDOMAIN tab, you will see a list of Domain IDs, Domain Names, Userspace details and External IDs. Click on the Domain ID you wish to enter. Notice you can also use the filter option to narrow your selection.

Navigating Back to the Main Domain

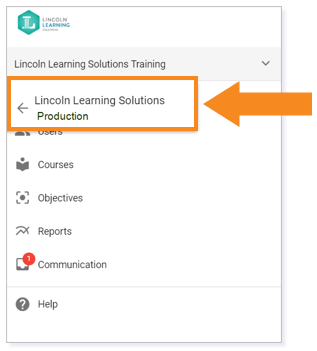
When you begin using Buzz as an Admin, you will be in the initial domain, but depending on the domain setup, you may need to move to other domains. Please use the steps below.

  1. Select the Main Menu navicon in the upper-left corner of the page.
  2. The top option is your domain.
  3. Click the down arrow and then select the option that contains Production (see right).
  4. This option will take you to the domain that contains users, courses, and data.

Click here to return to the list of Article Quick Links.

VIEWING A TEACHER'S COURSE: QUICK TIPS

To quickly view a teacher’s course, follow the steps below.

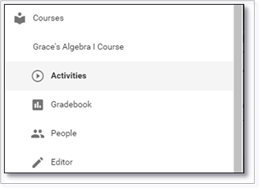
  1. Locate the teacher within the Admin Dashboard and click on their name.
  2. Click on the course name within the Teacher’s Dashboard under Active Courses.
  3. Use the left navigation menu to move to areas within the course such as the Gradebook or Activities.

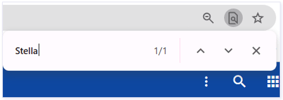
TIP: Use Ctrl + F to quickly find a teacher.

Click here to return to the list of Article Quick Links.

ADMIN DASHBOARD

When you first switch to the Admin role, you are brought to the Domain Dashboard. This dashboard provides instant analytics for the district and individual teachers.

NOTE: Depending on how a teacher is using the system, some analytics, like Active student summary, may be skewed.

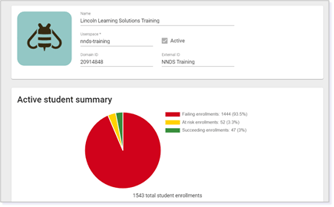
Below the Active student summary, you will find the Domain teacher summary. This information can provide quick details about teacher responsiveness, student performance, and student pacing.

Viewing a Teacher's Course

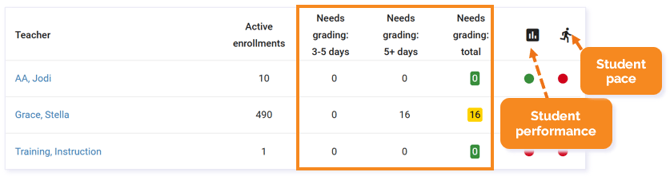
From the Admin Dashboard details, you can select a teacher’s name within the Domain teacher summary to open the details for the specific teacher.

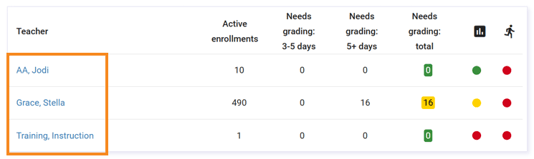
TIP: Since all teachers are listed in the Admin Domain Dashboard, use Ctrl + F to quickly find a specific teacher. Type the teacher’s name in the pop-up menu and click Enter. If you have multiple teachers with the same name, the find feature will highlight the name each place it is found within the list.

Teacher Dashboard

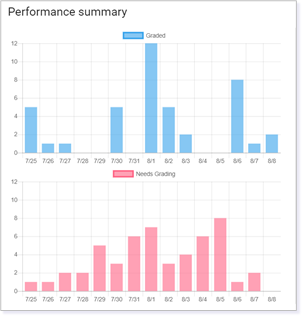
When you select a teacher’s name, you are taken to a teacher’s Performance Summary. This summary will display the teacher’s responsiveness in another way. Here, you can see what the teacher has graded and what needs to be graded each day within a two-week span.

The two bar graphs compare the activities that the teacher graded to those that the teacher still needs to grade at the end of the day.

Hover over the bar on either graph to see the specific number of activities.

Click on Teacher responsiveness to display the Needs Grading queue.

Click on Student performance or Student pace to open the People tool, which is filtered to show students who are failing (grade) or falling behind schedule (pace).

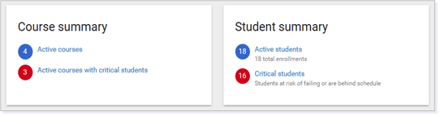
Course and Student Summaries

The Course summary card summarizes information such as the number of active courses for an individual teacher and the names of courses with students who need critical attention.

The Student summary card summarizes information such as the number of active students associated with an individual teacher and the number of those students who need critical attention.

Active Courses

The Active courses card contains information about active students, teacher responsiveness, student performance, and student pace. This card is different than the view on the Admin Dashboard as the Active courses card displays analytics per course rather than per teacher.

The Active students column lists the number of active students in each course.

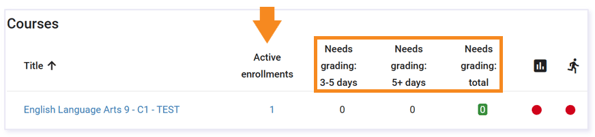
IMPORTANT: Clicking on the course name will open the course details for that specific course, including course content.

The teacher responsiveness column shows the overall status of items that need graded for each course. Click on the status indicator in this column to open the Needs Grading queue.

  • Green means all items in the Needs Grading queue are less than 2 days old.
  • Yellow means one or more items have remained ungraded for 3 or more days.
  • Red means one or more items have remained ungraded for 6 or more days.

For student performance:

  • Green means that students are performing above 10% of the minimum grade for the course overall.
  • Yellow means that students have failed 1 of their last 5 submissions or are within 10% of failing the course.
  • Red means that students have failed 2 of their last 5 submissions or are failing the course.

For student pace:

  • Green means that students are submitting all gradable items on time or that less than 10% of gradable items are past due.
  • Yellow means that 10% or more of the gradable items are past due from students.
  • Red means that 30% or more of the gradable items are past due from students.

IMPORTANT: Keep in mind that pacing in a continuous course is based on “soft-due dates.” In this case, students may not be responsible for meeting these dates.

Click here to return to the list of Article Quick Links.

QUICK SEARCH TIPS

As an Admin, you can use the search icon located in the top toolbar to search at any time.

Begin by selecting the area you want to search.

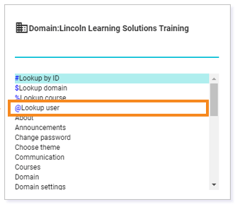
Initially, your search will show no results, but once you start typing, your search results will filter below.


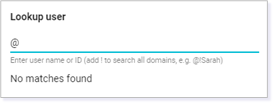
IMPORTANT: If you have subdomains, add an ! after the @ symbol to search all domains.

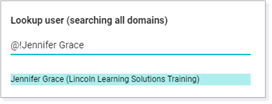
Once you locate your search results, click on it. You will then be brought to additional actions you can take based on your search.

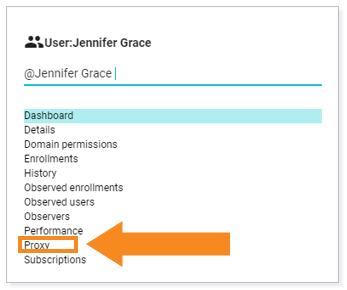
When searching Users, for example, you will see that you can click on Proxy to quickly Proxy as the user. For more information about Proxy, please read the Proxy section of this document.

TIP: Quick Search Tips can be repeated for course lookup as well.
Once you click on your course, you will see the actions associated to locations within the course.

Click here to return to the list of Article Quick Links.

FINDING A SPECIFIC USER

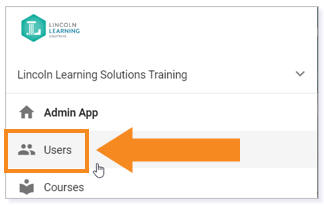
Once you are in the appropriate domain, select Users from the Main Menu.

This option will provide you with a list of all users in the domain. You can sort details by column headers.

Additionally, you can use the Filter field to search for a specific user.

Once you locate a user, click on their User ID number for additional user details.

NOTE: You may notice the option to edit. You have read-only access and will not be able to make edits to user details.

Click here to return to the list of Article Quick Links.

PROXY AS A USER

IMPORTANT: Proxying as a user may log activity for the user.

To proxy as a user, click on the avatar and then click Proxy.

Next, use the User ID to specify your user.

TIP: You can copy the User ID by following the previous steps. Try copying it so you can paste it here later.

Paste the User ID into the search field and select OK.

TIP: If you want to see a specific teacher’s Editor view of their Lincoln Learning course, it is best to proxy as that user. Locating the course and then going to the Editor will result in an error because the Client Administrator role is read-only; therefore, you must proxy as another user.

When you proxy as another user, you will see the option to Use as a Teacher or Use as a Student. The Use as a Teacher option will allow you to view the learning objects from the Lincoln Content Bank that teachers have saved or other items they may have added to the Syllabus of their course.

The Use as a Student option will show you the Lincoln Learning courses teachers can access.

To stop proxying as a specific user, click on the avatar and select the Unproxy option.

Click here to return to the list of Article Quick Links.

LOCATING A SPECIFIC COURSE

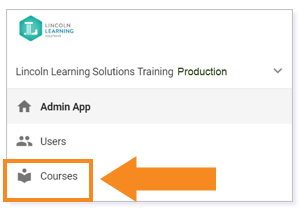
As a Client Administrator, you can view all courses within your domain. Select Courses from the Main Menu.

Again, you can sort details by column headers and use the Filter field to search for a specific course. 

Click on the Course ID to open the course.

Now, you can navigate to the Course Activities of your selected course to see content. Click on the navicon to open the Main Menu. Select Activities.

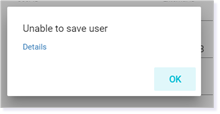
WARNING: Clicking the Editor from the Main Menu will cause an error, and you will need to log in again to resume access. This error is due to the Client Administrator read-only access. Remember, if you want to view the Editor of a course, proxy as the teacher and navigate to the Editor.

Click here to return to the list of Article Quick Links.

RUNNING REPORTS

Reports can be used to pull user activity data. Select Reports from the Main Menu and then select the User Activity tab. Here, you can run individual or domain-level user activity reports.

There are six options for reports that can be generated and customized as a Buzz Client Admin:

Click the tab to start customizing a report.

GRADEBOOK Report Steps

Clicking the GRADEBOOK tab, you can generate Course activity or Period and category summary reports.

TIP: GRADEBOOK Reports focus on content analytics. You will not see student specific data in this report.

Step 1

Choose between Course activity summary or Period and category summary.

  • Course activity summary – This report summarizes grade information (e.g., scores, failing, passing), time spent, and other data based on course activity.
  • Period and category summary – This report summarizes grade information (e.g., scores, failing, passing), time spent, and other data based on period and category.

Step 2

Choose a course by entering the course name or ID.

If you can’t find your course, try clicking the menu icon (three lines) to expand your search.

Step 3

Choose to exclude or Include past enrollments by selecting the box.

Select Choose filters to select from the following filters or select Get all data:

  • Time spent per activity
  • Score per activity
  • Failed & unsubmitted per activity

Step 4

Select EXPORT TO CSV to view the report or select BACK to make changes to your selections.

TIP: To customize your report further, convert your CSV file to an alternative file type (e.g., Excel, Google Sheet).

STUDENT Report Steps

Clicking the STUDENT tab, you can generate Student performance reports by course, by teacher, or by a single student.

TIP: STUDENT Reports focus on student analytics. You can find a glossary of options here.

Step 1

Choose between the following report types:

  • Student performance by course – Report performance for all students in a chosen course.
  • Student performance by teacher – Report performance for all students of a chosen teacher.
  • Single student performance – Report performance for all courses of a chosen student.

Step 2

Based on the Step 1 selection, you will specify your course, teacher, or student.

Choose by entering the name or ID.

If you can’t find your selection, try clicking the menu icon (three lines) to expand your search.

Step 3

Select an As of date. This will pull data from the date the student started the course up to the date specified.

TIP: If you want to compare one date to the next, use the ADD DATE option to put in two different dates. Use the earliest date as your first entry.

Step 4

Choose to exclude or Include past enrollments by selecting the box.

Select Choose filters to select from the following filters or select Get all data:

  • Time spent per student
  • Grade
  • Learning proficiency per student
  • Completion
  • Self assessment: understanding
  • Self assessment: interest
  • Self assessment: effort

TIP: Selecting Get all data can include additional analytics beyond the filter options above. You can always remove data once you customize your file.

Step 5

Select EXPORT TO CSV to view the report or select BACK to make changes to your selections.


TIP: To customize your report further, convert your CSV file to an alternative file type (e.g., Excel, Google Sheet).

MASTERY Report Steps

Clicking the MASTERY tab, you can generate Mastery by date range or All mastery data reports.

TIP: MASTERY Reports focus on mastery analytics only. You will not see student-specific data in this report.

Step 1

Choose between:

  • Mastery by date range – Report course mastery data for a specified date range.
  • All mastery data – Report course mastery data for all dates.

Step 2

Based on the Step 1 selection, you will specify your course, teacher, or student.

Choose by entering the name or ID.

If you can’t find your selection, try clicking the menu icon (three lines) to expand your search.

NOTE: Selecting All mastery data will take you from Step 2 to Step 4.

Step 3

Choose a date range to run a report.

Step 4

Choose to exclude or Include past enrollments by selecting the box.

Select Choose filters to select from the following filters or select Get all data:

  • Covered content per learning object
  • Student proficiency
  • Score per learning objective

Step 5

Select Export to CSV to view the report or select BACK to make changes.

TIP: To customize your report further, convert your CSV file to an alternative file type (e.g., Excel, Google Sheet).


USER ACTIVITY Report Steps

Clicking on the USER ACTIVITY tab, you can generate User login and logout times, User enrollment activity, Domain user activity, or Domain user inactivity reports.

TIP: USER ACTIVITY Reports focus on user activity. This report will contain the date and time per activity as well as time spent associated to a user.

Step 1

Choose between the following report types:

  • User login and logout times – Report login and logout times for a single user.
    • You will choose a user and date ranges, but there is no data filter option.
  • User enrollment activity – Report time spent in all of a single user’s enrollments.
    • You will choose user and filter data, but there is no date range.
  • Domain user activity – Report login and logout times and time spent for domain users with activity.
    • You will choose the domain, select a date range, and you can filter data.
    • When choosing the domain, choose the Production.
  • Domain user inactivity – Report domain users without any activity.
    • You will choose the domain and select a date range, but there is no data to filter.
    • When choosing the domain, choose the Production.

*For this example, we will walk through the User enrollment activity steps.

Step 2

Based on the Step 1 selection, you will specify your user or domain.

Choose by entering the name or ID.

If you can’t find your selection, try clicking the menu icon (three lines) to expand your search.

Step 3 (User enrollment activity)

For the User enrollment activity, determine if you want to Include past enrollments or Exclude overlapping time. Leaving the selection blank will still run the report with those options not included.

Step 3 (All Other Step 1 Options)

Step 3 is where you Choose date range if you select anything other than User enrollment activity.

Step 4 (Domain user activity)

For the Domain user activity, specify the maximum number of users. (The maximum number of users that can be included is 10,000.)

Next, determine if you want to keep the Login and logout times checked or whether you wish to include an Enrollment activity summary. Leaving the selection blank will still run the report with those options not included.

Step 4 (All other Reports)

Select Export to CSV to view the report or select BACK to make changes.

NOTE: This is Step 5 for Domain user activity.


TIP: To customize your report further, convert your CSV file to an alternative file type (e.g., Excel, Google Sheet).


TEST ANALYTICS Report Steps

Clicking the TEST ANALYTICS tab, you can generate reports associated to online assessments only. This will not pull analytics for upload assessments.

Step 1

Choose a course by entering the name or ID.

If you can’t find your selection, try clicking the menu icon (three lines) to expand your search.

Step 2

Choose an assessment by entering the name.

If you can’t find your selection, try clicking the menu icon (three lines) to expand your search.

Clicking on the menu icon (three lines), you will be able to expand the course folders to locate course assessments. Remember, these are only the online assessments.

Step 3

Determine if you want to Include past enrollments. Leave unchecked if you do not.

Step 4

Click RUN REPORT to access and view test analytics.

Once the report is loaded, you will notice that you can interact with the report to see question and mastery details.

If you do not see details, your test may not contain analytics or none of your students have submitted this assessment.

Step 5

Use the dropdown to the left of EXPORT CSV to determine which details you want to export.

If your assessment does not have full analytics, you will see only Test scores, Item responses, and Student proficiency as export options.

If your assessment has full analytics, you will see Test scores, Item responses, Item analysis, Learning object mastery, and student proficiency as export options.

Step 6

When ready, select EXPORT CSV. You can repeat EXPORT CSV for each drop-down option if desired.

TIP: To customize your report further, convert your CSV file to an alternative file type (e.g., Excel, Google Sheet).

OTHER Report Steps

Clicking the OTHER tab, you can generate more than 25 additional report types.

For each report, you will find the Scope (course or domain) and a brief Description.

Once you select a report, you can then Enter report parameters.

Finally, EXPORT TO CSV.

TIP: To customize your report further, convert your CSV file to an alternative file type (e.g., Excel, Google Sheet).

Click here to return to the list of Article Quick Links.


Please note the images found in this resource may not match your screen. Access and/or features may vary based on client contract.

© 2024 Lincoln Learning Solutions. All rights reserved.