
As a school admin, you may need to run reports to view student progress. Reports can be used to pull user activity data.
Select Reports from the Main Menu and then select the User Activity tab. Here, you can run individual or domain-level user activity reports.

There are six options for reports that can be generated and customized as a Buzz Client Admin:
Click the tab to start customizing a report.

Gradebook Report Steps
Clicking the Gradebook tab, you can generate Course activity or Period and category summary reports.
TIP: Gradebook Reports focus on content analytics. You will not see student specific data in this report.
Step 1
Choose between Course activity summary or Period and category summary.
- Course activity summary – This report summarizes grade information (e.g., scores, failing, passing), time spent, and other data based on course activity.
- Period and category summary – This report summarizes grade information (e.g., scores, failing, passing), time spent, and other data based on period and category.

Step 2
Choose a course by entering the course name or ID.
If you can’t find your course, try clicking the menu icon (three lines) to expand your search.

Step 3
Choose to exclude or Include past enrollments by selecting the box.
Select Choose filters to select from the following filters or select Get all data:
- Time spent per activity
- Score per activity
- Failed & unsubmitted per activity

Step 4
Select Export to CSV to view the report or select Back to make changes to your selections.

TIP: To customize your report further, convert your CSV file to an alternative file type (e.g., Excel, Google Sheet).
Student Report Steps
Clicking the Student tab, you can generate Student performance reports by course, by teacher, or by a single student.
TIP: Student Reports focus on student analytics. You can find a glossary of options here.
Step 1
Choose between the following report types:
- Student performance by domain – Report performance for all students in a chosen domain.
- Student performance by course – Report performance for all students in a chosen course.
- Student performance by teacher – Report performance for all students of a chosen teacher.
- Single student performance – Report performance for all courses of a chosen student.

Step 2
Based on the Step 1 selection, you will specify your domain, course, teacher, or student.
Choose by entering the name or ID.
If you can’t find your selection, try clicking the menu icon (three lines) to expand your search.

Step 3
Select an As of date. This will pull data from the date the student started the course up to the date specified.

TIP: If you want to compare one date to the next, use the Add date option to put in two different dates. Use the earliest date as your first entry.
Step 4
Choose to exclude or Include past enrollments by selecting the box.
Select Choose filters to select from the following filters or select Get all data:
- Time spent per student
- Grade
- Learning proficiency per student
- Completion
- Self assessment: understanding
- Self assessment: interest
- Self assessment: effort

TIP: Selecting Get all data can include additional analytics beyond the filter options above. You can always remove data once you customize your file.
Step 5
Select Export to CSV to view the report or select Back to make changes to your selections.

TIP: To customize your report further, convert your CSV file to an alternative file type (e.g., Excel, Google Sheet).
Mastery Report Steps
Clicking the Mastery tab, you can generate Mastery by date range or All mastery data reports.
TIP: Mastery Reports focus on mastery analytics only. You will not see student-specific data in this report.
Step 1
Choose between:
- Mastery by date range – Report course mastery data for a specified date range.
- All mastery data – Report course mastery data for all dates.

Step 2
Based on the Step 1 selection, you will specify your course.
Choose by entering the name or ID.
If you can’t find your selection, try clicking the menu icon (three lines) to expand your search.

NOTE: Selecting All mastery data will take you to Filter the data.
Step 3
Choose a date range to run a report.

Step 4
Choose to exclude or Include past enrollments by selecting the box.
Select Choose filters to select from the following filters or select Get all data:
- Covered content per learning object
- Student proficiency
- Score per learning objective

Step 5
Select Export to CSV to view the report or select Back to make changes.

TIP: To customize your report further, convert your CSV file to an alternative file type (e.g., Excel, Google Sheet).
User Activity Report Steps
Clicking on the User Activity tab, you can generate User login and logout times, User enrollment activity, Domain user activity, Domain users not logged in, or Domain enrollment activity reports.
TIP: User Activity Reports focus on user activity. This report will contain the date and time per activity as well as time spent associated to a user.
Step 1
Choose between the following report types:
- User login and logout times – Report login and logout times for a single user.
- You will choose a user and date ranges, but there is no data filter option.
- User enrollment activity – Report time spent in all of a single user’s enrollments.
- You will choose user and filter data, but there is no date range.
- Domain user activity – Report login and logout times for all users and total time spent for student enrollments in a domain.
- You will choose the domain, select a date range, and you can filter data.
- When choosing the domain, choose the Production.
- Domain users not logged in – Report users who have not logged in but are actively enrolled in a domain.
- You will choose a user and date ranges, but there is no data filter option.
- When choosing the domain, choose the Production.
- Domain enrollment activity – Report time spent on activities for student enrollments in a domain.
- You will choose the domain and select a date range, but there is no data to filter.
- When choosing the domain, choose the Production.
*For this example, we will walk through the User enrollment activity steps.

Step 2
Based on the Step 1 selection, you will specify your user or domain.
Choose by entering the name or ID.
If you can’t find your selection, try clicking the menu icon (three lines) to expand your search.

Step 3 (User enrollment activity)
For the User enrollment activity, determine if you want to Include past enrollments or Exclude overlapping time. Leaving the selection blank will still run the report with those options not included.

Step 3 (All Other Step 1 Options)
Step 3 is where you Choose date range if you select anything other than User enrollment activity.

Step 4 (Domain user activity)
For the Domain user activity, specify the maximum number of users. (The maximum number of users that can be included is 10,000.)
Next, determine if you want to keep the Login and logout times checked or whether you wish to include an Enrollment activity summary. Leaving the selection blank will still run the report with those options not included.

Step 4 (All other Reports)
Select Export to CSV to view the report or select BACK to make changes.

NOTE: This is Step 5 for Domain user activity.
TIP: To customize your report further, convert your CSV file to an alternative file type (e.g., Excel, Google Sheet).
Test Analytics Report Steps
Clicking the Test Analytics tab, you can generate reports associated to online assessments only. This will not pull analytics for upload assessments.
Step 1
Choose a course by entering the name or ID.
If you can’t find your selection, try clicking the menu icon (three lines) to expand your search.

Step 2
Choose an assessment by entering the name.
If you can’t find your selection, try clicking the menu icon (three lines) to expand your search.

Clicking on the menu icon (three lines), you will be able to expand the course folders to locate course assessments. Remember, these are only the online assessments.

Step 3
Determine if you want to Include past enrollments. Leave unchecked if you do not.

Step 4
Click Run Report to access and view test analytics.

Once the report is loaded, you will notice that you can interact with the report to see question and mastery details.
If you do not see details, your test may not contain analytics or none of your students have submitted this assessment.

Step 5
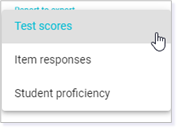
Use the dropdown to the left of Export CSV to determine which details you want to export.

If your assessment does not have full analytics, you will see only Test scores, Item responses, and Student proficiency as export options.
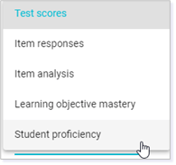
If your assessment has full analytics, you will see Test scores, Item responses, Item analysis, Learning object mastery, and student proficiency as export options.
Step 6
When ready, select Export CSV. You can repeat Export CSV for each drop-down option if desired.

TIP: To customize your report further, convert your CSV file to an alternative file type (e.g., Excel, Google Sheet).
Other Report Steps
Clicking the Other tab, you can generate more than 25 additional report types.
For each report, you will find the Scope (course or domain) and a brief Description.

Once you select a report, you can then Enter report parameters.

NOTE: Depending on the type of report you choose, you may be asked to enter report parameters, or target, or nothing at all.
Finally, Export to CSV.

TIP: To customize your report further, convert your CSV file to an alternative file type (e.g., Excel, Google Sheet).
Click here to return to the list of Article Quick Links.
Please note the images found in this resource may not match your screen. Access and/or features may vary based on client contract.
© 2025 Lincoln Learning Solutions. All rights reserved.