This article provides an overview of the Teacher Dashboard in Buzz.
Buzz includes a Dashboard tab located on the Home page. This dashboard provides valuable data on teacher and student activity.
ACCESSING THE DASHBOARD
Select the DASHBOARD tab on the upper left side of the Home page.
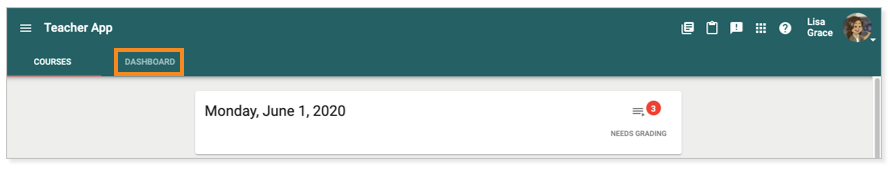
The dashboard displays. It contains information regarding teacher responsiveness, student performance, and student pace.
PERFORMANCE SUMMARY
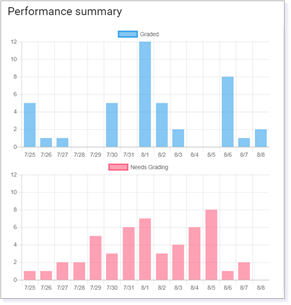
The first section of the dashboard is the Performance summary. This section provides data on teacher and student performance.
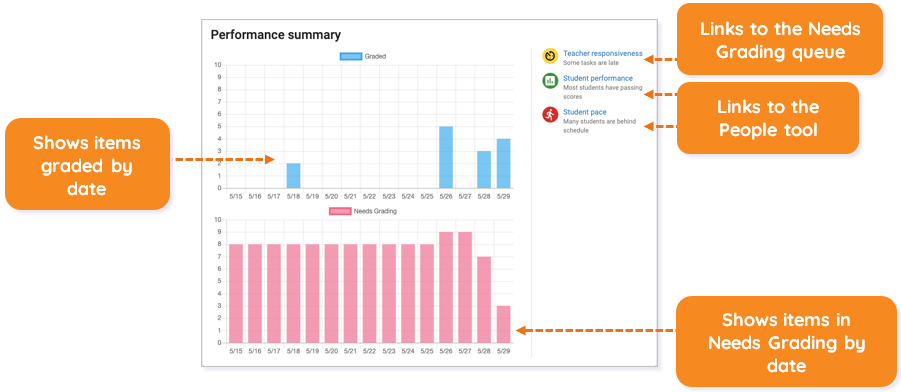 The two bar graphs compare the activities that were graded on each day (blue) to those in the Needs Grading status at the end of the day (red). Hover over a day on either graph to see the specific numbers of activities.
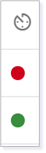
Click Teacher responsiveness to display the Needs Grading queue.
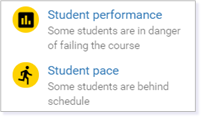
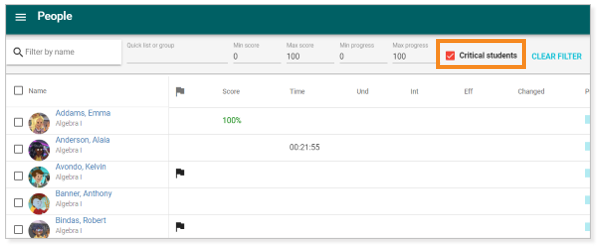
Click Student performance or Student pace to open the People tool, which is filtered to show students who are failing (grade) or falling behind schedule (pace).
COURSE AND STUDENT SUMMARIES
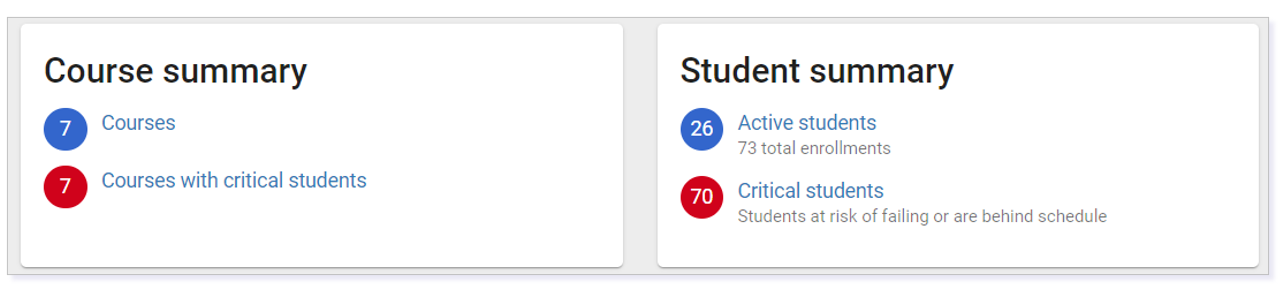
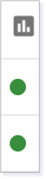
The Course summary card summarizes information including the number of courses and the names of courses with students who need critical attention. Click on the summaries for details.
The Student summary card summarizes information including the number of active students and the number of students who need critical attention. Click each summary for details.
COURSES
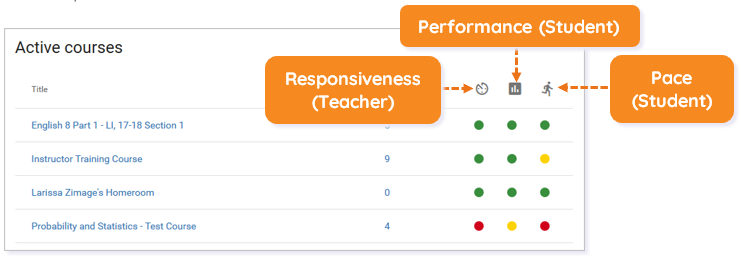
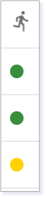
The Courses card contains information on active students, teacher responsiveness, student performance, and student pace.
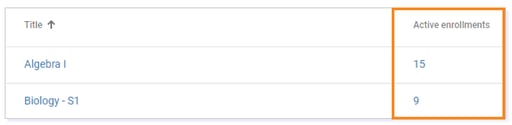
The Active enrollments column lists the number of active students in each course.
IMPORTANT: Keep in mind that pacing in a continuous course will be based on soft due dates. In this case, students may not be responsible for meeting these dates.
Please note, the images that may be found in this resource may not match your screen.
This is a Lincoln Learning Solutions product. Access/features may vary based on client contract.
© 2022 Lincoln Learning Solutions. All rights reserved.