
Having the ability to run reports, view levels of mastery, and monitor students' course progress is essential for teachers to guarantee greater achievement and success for students using the Lincoln Learning Solutions (LLS) curriculum.
Each LMS will have unique tools and features to assist in ensuring teachers can support their students in progressing through their course content.
If you do not see your LMS listed, visit your LMS help center for assistance.Buzz
Click the link below to navigate directly to that topic.
- Grades Tab
- Individual Student Gradebook
- Analytics
- Gradebook Toolbar
- Additional Gradebook Tabs
- Reports
- Additional Buzz Resources
Grades Tab
Upon opening the Gradebook, the Grades tab automatically opens. This tab allows you to see all your students, their LLS assessments, and their current grades. You can also see assessments that have been submitted but need to be graded. These could be LLS online assessments which need an essay graded or an LLS upload assessment needing attention. This tab also shows whether a student was allowed a retry or if you left comments on a student’s assessment.

Individual Student Gradebook
Reviewing How do I use the Student Grades screen? will give you more insight on how to effectively view and use the Student Gradebook.

Analytics
The How do I use the Activity Grader? resource provides an overview of the Activity Grader and the Analytics tab found within it. How do I review and export activity Analytics for my course? provides more detailed information regarding information found in the Analytics tab.

WARNING: If you are using Lincoln Learning Solutions Teaching Services, these reports may not be available.
NOTE: Not all analytics are available for upload assessments.
Gradebook Toolbar
Review the How do I enter grades? resource to learn about the Buzz Gradebook Toolbar and how each toolbar icon functions. How do I use the Performance/Gradebook tool? also gives an in-depth view of how to manage Display Options.
TIP: When you see the Show printer-friendly version icon in the toolbar, you can save and print a copy of the gradebook view.

Additional Gradebook Tabs
How do I use the Performance/Gradebook tool? provides an overview of the three remaining tabs in the Gradebook.
- Mastery
- Unit Summary
- For Me
TIP: Featuring the Unit Summary tab, the below video highlights ideas for viewing additional details on what a student has or possibly has not done within a course.
Run Time: 03:57
Reports
As a teacher, you can run customized class and student reports for gradebook, performance, and mastery-level analytics.
WARNING: If you are using Lincoln Learning Solutions Teaching Services, these reports may not be available.
Three types of reports can be generated and customized:
Gradebook
Review How do I run Gradebook Reports? for information and steps to successfully generate a Gradebook Report.

Student
How do I run Student Reports? is a resource that contains information and steps to generate Student Reports.

Mastery
Follow the steps and information in How do I run Mastery Reports? for tips on how to create Mastery Reports.

Additional Buzz Resources
How do I review my students' progress on mastering objectives?
Click here to return to the top of the article.
Canvas
Grades
You can view the gradebook by selecting the Grades link in the left panel of course. Visit the How do I use the Gradebook? resource to learn how to use a variety of functions within the gradebook.

Student Progress
The types of progress monitoring you can do in Canvas are dependent on your account setup.
TIP: Contact your Canvas admin with any questions you may have regarding your account setup and settings.
Whether your account has Analytics or New Analytics will inform your decisions on what types of course and student progress analytic reports you can generate.
Analytics
With Analytics, you can view both course and student analytics within a course. Review How do I view Course Analytics? and How do I view analytics for a student in a course? for more information to see numerical and graphical information regarding progress within your course.
New Analytics
With New Analytics, not only will you be able to see course and student progress, but you will also be able to compare information, send messages, check attendance, and more. You can run reports from the Reports tab in the New Analytics page.
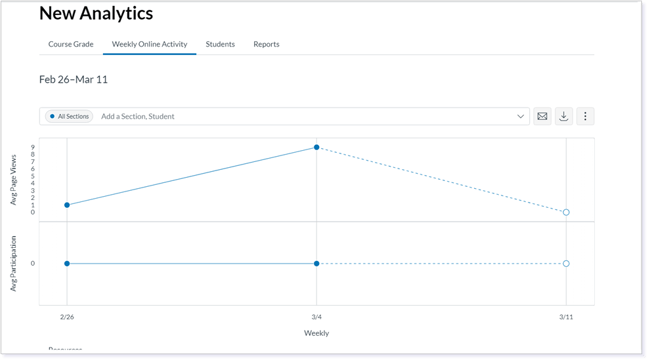
Follow the steps in How do I view New Analytics in a course as an instructor? for graphical and numerical information regarding a single student's progress in your course.
Additional Canvas Resources
Additional Progress Monitoring Options
In Canvas, course and student progress monitoring can be done in a variety of places. Reference the Outcomes categories in Canvas Guides to see additional resources.
Click here to return to the top of the article.
Schoology
Grades
In Schoology, student’s grades can be viewed by selecting the Gradebook in the left panel of a course. Visit the Courses: Gradebook resource for more details.

Course Analytics
With Course Analytics you can gain insights into the overall usage of Schoology at the course level.

Review the Schoology Course Analytics resource to learn more.
Additional Schoology Resources
Click here to return to the top of the article.
Please note, the images that may be found in this resource may not match your screen.
This is a Lincoln Learning Solutions product. Access/features may vary based on client contract.
© 2025 Lincoln Learning Solutions. All rights reserved.